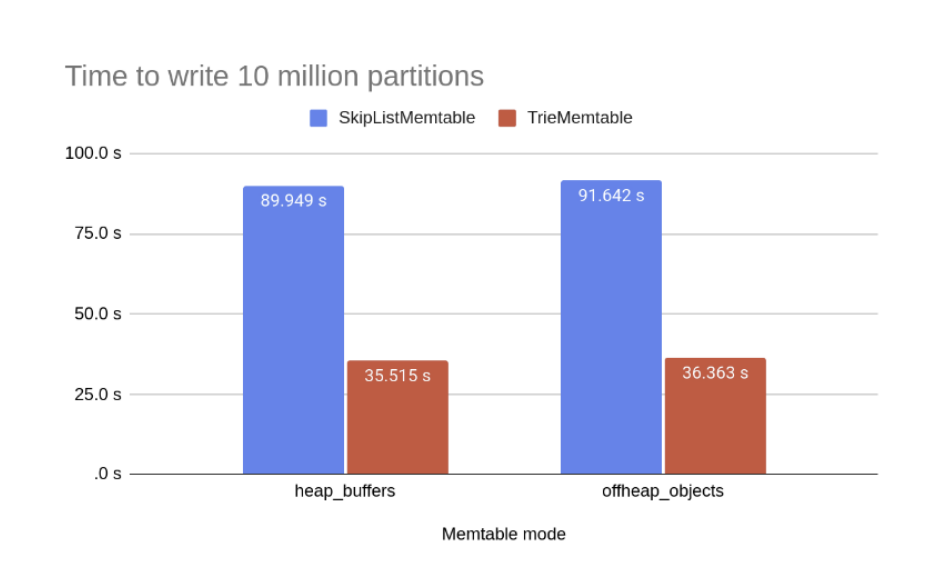
I stumbled upon this paper, Trie Memtables in Cassandra by Branimir Lambov, Datastax, which discusses how Cassandra optimized its memtables. Overall, there is a considerable improvement in performance, in one case bringing time to write by almost $50$% as well, and hence I got really curious about how they are achieving this. There is already a spoiler in the title :).
This blog is no way trying to do a deep dive into this paper, cause the paper itself is dense, but rather my notes and takeaways from this.
Using Tries Over SkipList Link to heading
Traditionally, memtables use BTrees or SkipList to store the key of the data. While implementing them is easier, there is an overhead of comparing 2 keys end to end (Average length being $K$) and logarithmic overhead of both the mentioned structures ($O(Klog(N))$)
This is where the first optimization of Cassandra comes, which uses Tries over this structure. They convert these keys into bit format and then store this bit format as a Trie. This brings the complexity down to ($O(K)$) on average.
There is an added benefit of less space that Trie uses on average when compared to traditional structures, which helps a lot in Java GC optimization that we will see in the next part of this blog.
Java Garbage Collector Optimizations Link to heading
A two-edged sword that Java has is the garbage collector. At one place, it helps you to focus on implementing core login and leave the optimization of pointers and references to the JVM, and at another place, if you are building high high-performance, low-latency service, you want to be less dependent on a somewhat black box internal garbage collector. There is also the dreaded stop-the-world event, where having a lot of references in the older generation GC stage can incur huge pauses.
One of the main things that the paper focused on was how we can reduce the GC footprint on actual code. There are 2 main strategies here.
Either store a large chunk of data outside of memory managed by Java - In this GC will never be incurred, so developers will have to handle freeing memory
Create fewer objects on the heap - Java GC uses mark and sweep to clear off reference-less objects. Fewer objects mean less time spent on marking and the sweep algorithm. This does not mean allocate less space; it just means allocate fewer objects. We will see in the code what I mean by this
Talks are boring, so we will code a small prototype to test each claim.
A simple prototype here is a programme doing simple memory allocations.
First are the actual objects, which are on the heap and cannot be moved. (Say any new Java object that is being created and deleted constantly).
private static final int SMALL_ALLOC_COUNT = 100_000_000;

private static void allocateSmallObjectOnHeap(){
    for (int i = 0; i < SMALL_ALLOC_COUNT; i++) {
        byte[] temp = new byte[128];
        if (i % 100 == 0) {
            temp[0] = (byte) i; // Lightly "use" the memory, gpt suggested that java optimizes this loop, so just add a little complexity here.
        }
    }
}
We also have movable_data, which can be moved, and we will see how storing them in different ways is useful. Let’s run them with 2Gb of external and internal JVM memory and see how they perform.
I am going to use the actual time spent on running the programme vs the time spent on running this on GC1
- Allocating movable_data on the heap, which is managed by GC
List<byte[]> largeOnHeapAllocation = new ArrayList<>();
for (int i = 0; i < 700; i++) {
    largeOnHeapAllocation.add(new byte[1024 * 1024]); // 700*1MB chunks onheap
}
allocateSmallObjectOnHeap();
- Allocating movable_data off heap (outside of JVM jurisdiction, so no garbage cleaning for this object)
List<ByteBuffer> largeOffHeapAllocation = new ArrayList<>();
for (int i = 0; i < 700; i++) {
    largeOffHeapAllocation.add(ByteBuffer.allocateDirect(1024 * 1024)); // 700*1MB chunks offheap
}
allocateSmallObjectOnHeap();
- Allocating moveable_data on the heap, but just as 1 big chunk rather than a number of smaller chunks(thus fewer objects)
List<byte[]> largeOnHeapAllocation = new ArrayList<>();
largeOnHeapAllocation.add(new byte[700*1024 * 1024]); // Big 700 MB chunks onheap
allocateSmallObjectOnHeap();
Here is how each allocation stategy performed2
| Allocation Type | Throughput (CPU time on actual task vs GC task) | Test Result |
|---|---|---|
| On Heap as multiple objects | 82% | Link |
| Off Heap as multiple objects | 89% | Link |
| On Heap as single objects | 91% | Link |
On Heap declaration of memory is the benchmark, and there is a substantial difference in throughput when compared to off-heap or simply less object allocation. In fact, if we have a single object in the heap that is taking a lot of space, then Java GC also has to work on a smaller space for the remaining objects. This also explains why there is an increase in throughput for a single heap-allocated object.
For the scale at which Cassandra operates, it does make sense that this throughput will result in actual latency gain or loss as well.
Cassandra uses multiple optimizations for their GC performance.
Instead of creating this Trie as a Java object, they created their own format of representing nodes as large chunks of Byte Objects. The size of each byte object is equal to 32 Bytes (this is done to fit each byte object in cache line size). They also created a byte representation of each kind of data format.
Cassandra also uses their own version of Trie, which in turn is the combination of many optimizations, where each node holds lots of information about other nodes, or just avoids too many linear chains.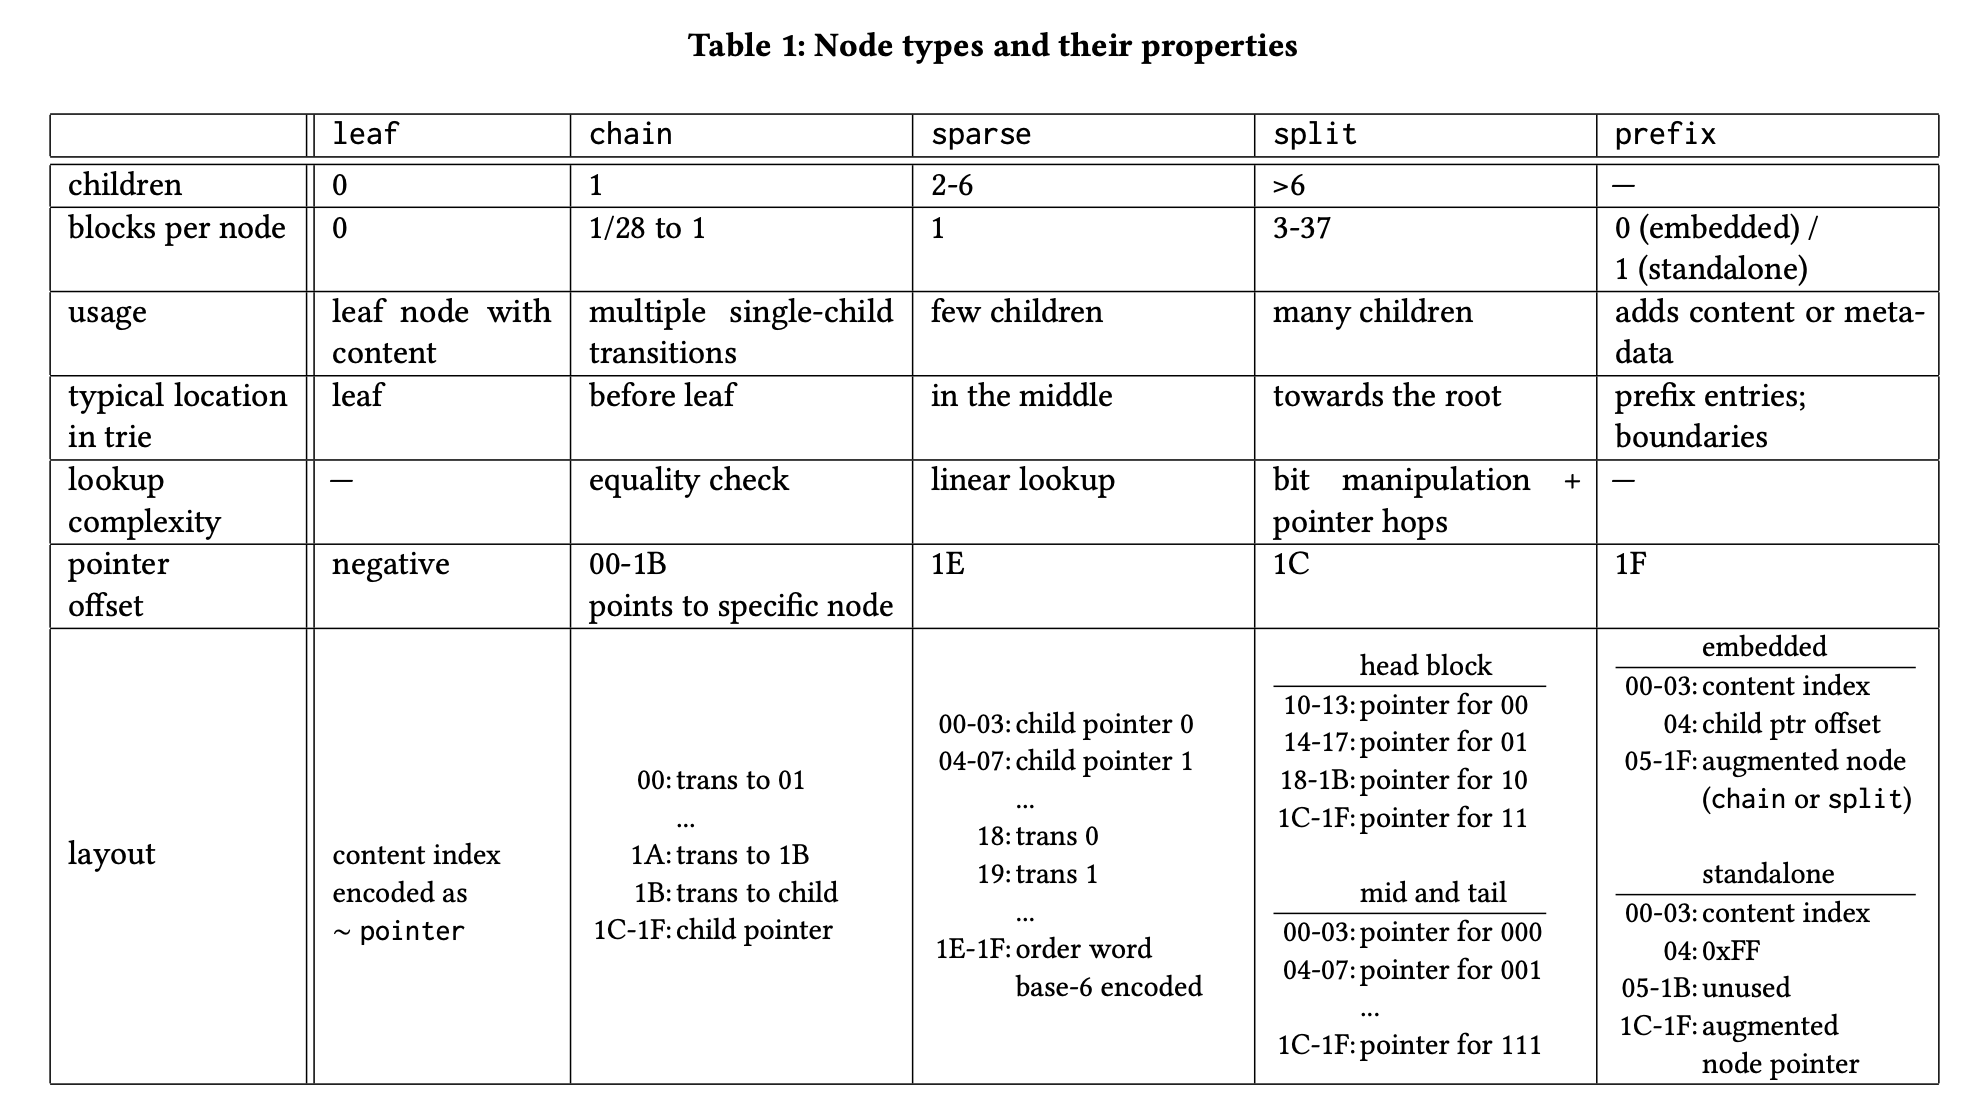
Both of the above factors result in a structure which have large dense byte objects, but the number of such objects is kept in check to get high throughput.
The paper discusses a lot of micro optimizations as well, such as handling concurrency in trie and SSTable implementation of the same structure, but I will keep that as something that I can revisit later.